Introduction
The study I chose for the project is one of the example studies posted: ‘Single-cell transcriptional profiles in human skeletal muscle’ by Rubenstein et. al (2020). The overall aim of this study was to characterize muscle cells gene expression at the single cell level to understand effects of exercise and pathophysiology of muscle disease for different skeletal muscle cell types. When characterizing gene expression with regular RNA sequencing (RNAseq) (as opposed to single cell RNA sequencing (scRNAseq)), it is necessary to have well characterized gene signatures of each cell type in a bulk sample to estimate differences in cell-type proportion vs. changes in gene regulation between bulk samples containing different cell types. These signatures had not been established for skeletal muscle tissues, making it difficult to deconvolve differences in proportion of cell types vs. gene regulation changes between skeletal muscles samples when using RNAseq data from bulk samples. This paper addressed this issue by employing scRNAseq to obtain comprehensive marker gene panels for the cell types found in human muscle genes. In addition to this marker gene characterization, this paper reports a discovery of a previously uncharacterized human FAP (Fibro-adipogenic progenitor) cell population. The paper demonstrates the utility of newly identified marker genes by employing them to deconvolve a previously published large human skeletal microarray dataset.
The type of data used in the study was scRNAseq from human and mouse samples, as well as microarray data from human samples. RNAseq data comes in FASTQ and BCL format, however the data that I accessed was pre-processed as counts matrices of (genes x cells) in .csv format. There were 4 of these count matrices in total: one for each of the 4 samples subjected to scRNAseq in this study. The data can be accessed here
Methods
I structured my code to first read in and organize the data so that I could analyze it. This was fairly straightforward: read in 4 .csv files and concatenate them into one data frame by joining them based on gene, since they all of the same genes for row indices. Next, I transformed the data frame into an Anndata object, because this is the required format for the module Scanpy, a python module I used which is based off Seurat, an R package for single-cell genomics. The last thing I needed to do before analysis was normalize the data; while the data was preprocessed, it was not normalized across all 4 samples. The paper did not specify a method, so I used a common method, which is scaling the data per cell, so that all of the cells have the same total read count (I chose 1000 reads) and then log1p() transforming the entire matrix. This second step stabilizes the variance and improves PCA results by reducing multiplicative differences in non-log transformed data to additive differences (Booeshaghi et. al).
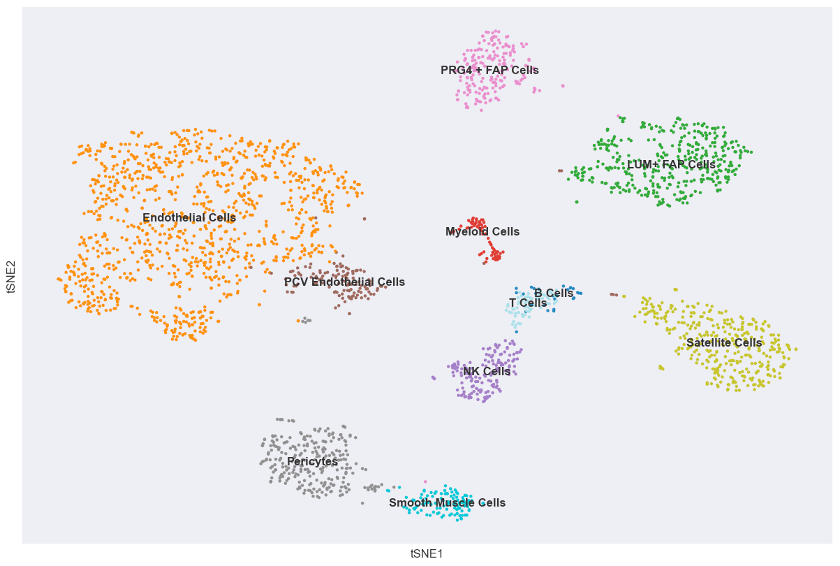
Next, I did PCA and plotted variance ratios to understand how much variability each of the 31 calculated PCs explained. Following this step, I performed T-SNE using 10 PCs (because this was stated in the paper and it is a reasonable cutoff based on the PC elbow plot) and clustering on the dataset, which produced 11 clusters, which is the same number as were produced in the paper. To understand how to label the clusters, I looked at expression of key marker genes that were listed in the supplementary materials for each of the 11 cell types identified. This extensive plotting of gene expression for each cluster and knowledge of the marker genes for each cell types made it clear which cluster belonged which cell type label.
There were two special changes that the paper made, that I also needed to follow however: one cluster needed to be merged and one cluster needed to be split. In the paper and in my own analysis, two of the clusters produced by T-SNE were endothelial cells, so this needed to be merged into one cluster to improve plotting and characterization. I did this by reassigning all names of clusters and just assigning these two clusters the same name, which worked. The other change was that T Cells and B Cells were clustered together, however, as pointed out by the paper, these two groups could be differentiated based on the expression of the CD3D gene, which only occurs in T cells. In order to split this group, I actually had to extract the list of cells in the T and B cell cluster that had expression of this gene, make a new ‘obs’ variable in the Anndata object, and assign these cells as T cells and assign all other cells the same group as they had in the original cell type ‘obs’ variable.
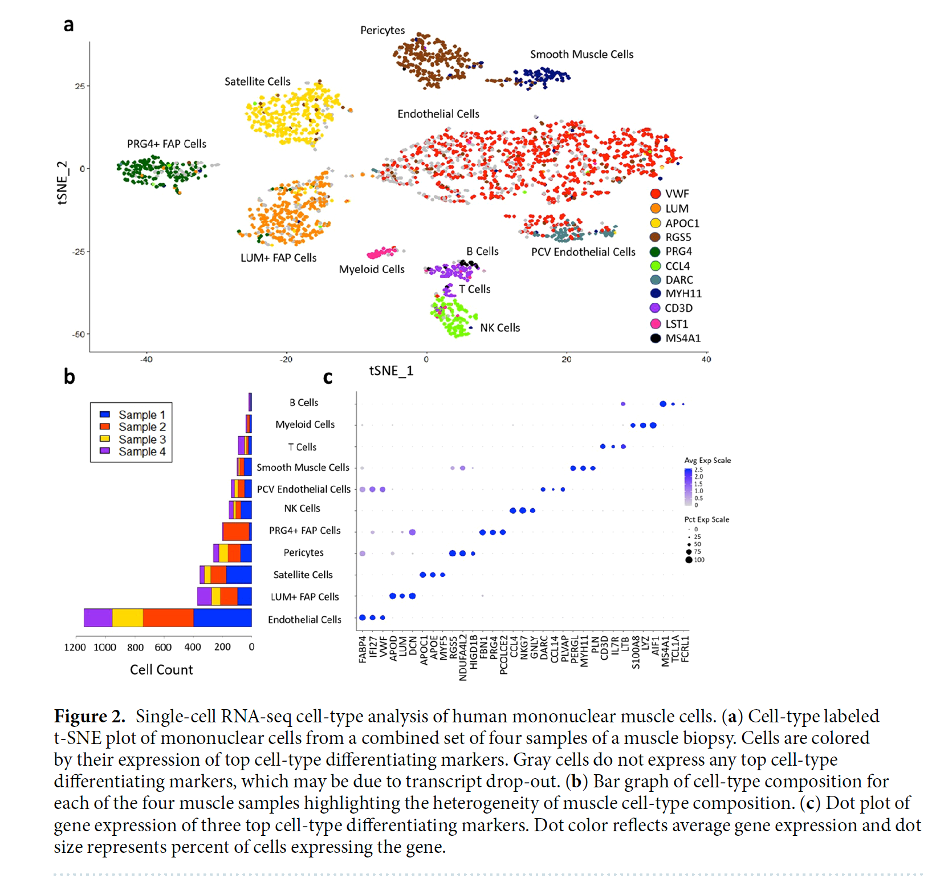
I did some exploratory plotting to look at the highest expressed genes in the dataset as well, however most of these genes were not marker genes; they were other genes (probably constitutively expressed housekeeping genes of some sort), so I did not get clear results that matched with identified highly expressed marker genes in fig. 2a in the paper. It was difficult to understand how they filtered and selected marker genes for each cell type, because while there is a long list of marker genes provided in the supplement for each cell type, they clearly were choosing from a smaller list when annotating top expressed genes in fig. 2a, since many of the top expressed marker genes I identified and plotted were not in the original figure.
I moved on from trying to figure out how they plotted marker genes in fig. 2a to replicating figs. 2b and 2c. For fig. 2b, I ended up reading in the files again put cell barcodes and sample name into a data frame, to which I then added a cell type column by merging on cell barcode with the Anndata object. Lastly, I replicated fig. 2c, which looks highly similar except for B-cell expression, for which the genes that they identified as highly expressed in B cells were not so highly expressed for my analysis. Also, they show a gene in that fig. ‘PERGL’, which was not in the dataset and which I could not identify when I searched it online.
Original Figure 2 From the Paper


Results and Conclusions
My results are highly similar to those of the paper. My version of fig. 2a shows the same pattern of clustering by cell type as in the paper, and, since I used expression patterns of the same key marker genes to label my clusters, this indicates the utility of those genes as signatures for deconvolution. Interestingly my clusters are not exactly the same in size or spatial distribution as in the paper, but this makes sense given that T-SNE is not a deterministic method and I did not use the same hyperparameters as them for T-SNE since such highly specific details were not included in the methods.
The counts of each cell type in the dataset, shown in 2b, is highly similar in my analysis to the original paper as well, however, I do not actually know their true counts so cannot do an exact comparison. Similarly, the 3 most highly expressed marker genes for each sample are similar, except for those of B cells. I plotted the exact same genes as they did in their plots, but clearly MS4A1, TCL1A, and FCRL1 are not highly expressed in B cells based on my analysis. I am not sure for the reason of this discrepancy. I also am unsure why they included the gene PERGL in this plot when I could not find this gene in the dataset or at all when I searched for it online.
Overall, my results closely replicate those in the paper, with a few curious exceptions. The replicability points to the fact that this data is not overly noisy, it was processed in the paper in a standard replicable way, there is differential expression of identified marker genes across clusters, and more generally different gene expression profiles across the 11 identified cell types. The authors also used R for their analysis, while I used Python, so slight differences in the source code could explain some of the differences in our figures. The only glaring differences are the B cell expression profiles in fig. 2b and the mysterious ‘PERGL’ gene that is in their fig. 2b but does not seem to exist. These could be further investigated with additional searches to understand what gene PERGL is referring to, and trying slightly different methods to classify B cells than those that I used.
References
Wolf, F. A., Angerer, P., & Theis, F. J. (2018). SCANPY: Large-scale single-cell gene expression data analysis. Genome Biology, 19(1). https://doi.org/10.1186/s13059-017-1382-0
Rubenstein, A. B., Smith, G. R., Raue, U., Begue, G., Minchev, K., Ruf-Zamojski, F., Nair, V. D., Wang, X., Zhou, L., Zaslavsky, E., Trappe, T. A., Trappe, S., & Sealfon, S. C. (2020). Single-cell transcriptional profiles in human skeletal muscle. Scientific Reports, 10(1). https://doi.org/10.1038/s41598-019-57110-6
Sina Booeshaghi, A., & Pachter, L. (2021). Normalization of single-cell RNA-seq counts by log(x + 1)† or log(1 + x)†. Bioinformatics, 37(15), 2223–2224. https://doi.org/10.1093/bioinformatics/btab085